Who wants homework on weekends? Find out how statistics can be misleading by creating your own survey to purposely slant the results.
1.
Research and facts to support ideas are everywhere. Critical readers and listeners understand that sometimes this information can be misleading. Authors and surveyors can manipulate statistics to support their ideas in ways that stretch the truth. Find articles that contain data and statistics. The use of percentages, statements such as, "3 out of 4 people surveyed said that…," and ranked lists of favorites are all clues that you are reading statistics.
2.
Bias is an attitude that favors one way of thinking over another. Look at the statistics you found. How might a surveyor’s biases affect the statistics? The surveyor might employ a "choice bias" by offering several unpopular choices along with one favored choice. For example, choices for how to spend a Saturday afternoon might include doing really hard chores, chopping stinky onions, staring at the wall, or doing homework. Which would most students choose?
3.
Another slanted survey method, "presentation bias," presents one choice very well while the others are at a disadvantage. For example, the survey might ask which ice cream is best, and then present chocolate in a dirty bowl, vanilla melted on a paper plate, strawberry with lots of salt on it, and a big scoop of butterscotch in a bright bowl.
4.
Work with a team of classmates. Brainstorm survey topics for a poll of students in your class, grade, or school. Think of response choices for your three favorite survey topics. Which topic would lend itself best to either type of bias? How could you change the question and/or the survey choices to be able to slant the results later?
5.
Use Crayola Colored Pencils to create your survey sheets. Write the question across the top of the page. Write the survey choices down the left side. Poll the group. Record the survey responses with tally marks beside the choices. Calculate the results.
6.
Use Crayola Dry-Erase Markers to graph the results of your survey. Create a bar graph, pie chart, or pictograph on a dry-erase board. Share the results with your classmates. Discuss the ethical implications of bias in statistical data.
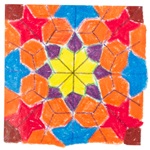
Study the complex, geometric ornamentation of Islamic art. Discover intricate, authentic Zillij designs using math and a
Greet school and classroom visitors with special occasion painted cloth wallhangings.
Invent a math game that uses real-life transportation timetables! Where (and when) will you arrive?
Who wants homework on weekends? Find out how statistics can be misleading by creating your own survey to purposely slant
Discover the vibrant colors and patterns of traditional African fabrics! Create a classroom textile quilt that explores
Imagine yourself as a computer engineer, a Web master, or in some other exciting computer career. Explore the possibilit
Hold a favorite color election then construct graphs to present data.
Explore Chinese culture, language, and traditional symbols. Discover how to write numerals with Chinese characters.